You pull into the station on a cold January morning, fuel light blinking, fingers stiff on the steering wheel. Prices glare back at you from the big sign at the entrance, but once you’re actually at the pump, it’s the usual blur of numbers and tiny labels. You tap the screen, start filling, and a dull thought crosses your mind: I have no idea what all this really costs me over a year. I just pay and hope for the best.
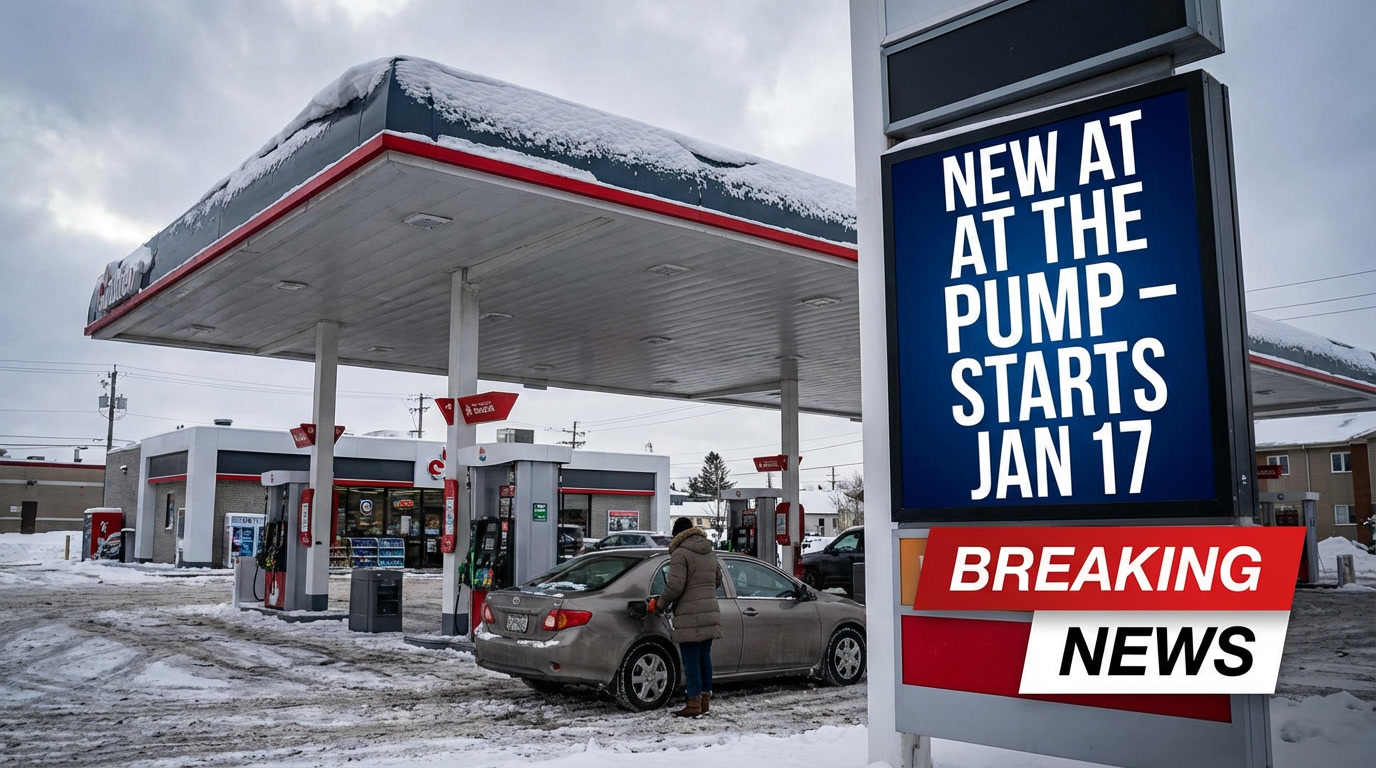
From 12 January, that familiar scene will change a little. A new piece of information will quietly appear right where you hold the nozzle. Small change, you might think. Yet it may gently shake the way you look at your fuel stops.

Because this time, the numbers won’t only be about litres.
From “price per litre” to “price per 100 km”: what changes at the pump
From 12 January, service stations will have a new legal duty: alongside the traditional price per litre (or per kWh), they must display an estimated average cost per 100 kilometres for each energy sold. Not on some distant poster near the cashier, but directly at the pump, within the driver’s line of sight.
This requirement, introduced under consumer information rules reinforced by national authorities and aligned with broader EU transparency objectives, is meant for ordinary drivers, not energy specialists. Instead of juggling litres, tank size and vague consumption figures in your head, you’ll see a simple, relatable number: “With this fuel, an average vehicle costs around X per 100 km.”

Suddenly, your weekly commute or your holiday road trip stops being an abstract budget line and turns into something concrete and comparable.
In countries like France, where the rule is now coming into force, authorities such as the DGCCRF and the Ministry for the Ecological Transition have been clear about the goal: help drivers understand real usage costs, not just unit prices, as explained on official portals like https://www.service-public.fr and https://www.ecologie.gouv.fr.
Why this matters more than it looks
Take a very common situation. You’re hesitating between classic petrol and E10, or you glance at E85, diesel, or even the electric charging point nearby. Until now, your brain mostly compared big numbers on signs: €1.89 per litre here, €1.79 there, or a kWh price that feels oddly abstract.

With the new rule, stations must show a “per 100 km” cost calculated using standardised consumption data defined by public authorities. In practice, you might see something like:
| Energy type | Indicative cost per 100 km | What it tells you |
|---|---|---|
| Petrol (E10) | ~€11 / 100 km | Familiar, but often costlier over distance |
| Diesel | ~€8.50 / 100 km | Lower running cost for long distances |
| E85 biofuel | ~€6–7 / 100 km | Cheap per km, if your car is compatible |
| Electric | ~€4–5 / 100 km | Very low driving cost, charging dependent |
The exact numbers will vary with prices and official reference consumption, but the logic is fixed. You’re no longer comparing apples and oranges. You’re comparing what a typical 100 km drive actually does to your wallet.
This is precisely what regulators want. For years, drivers have been lost between fuels, biofuels, LPG, hydrogen, electricity, hybrids. Each came with its own unit: litres, kilos, kWh. The result? Confusion, hesitation, and decisions based more on habit than understanding.
By forcing a common scale – cost per 100 km – authorities aim to create a more honest playing field, in line with EU consumer protection principles described by the European Commission at https://ec.europa.eu/info. The idea isn’t to shame anyone for their car choice, but to bring clarity. When numbers become readable, choices slowly become freer.
How to actually use this new info to spend less
The smart move starts with a very simple reflex. Before grabbing the nozzle, pause for three seconds on this new “per 100 km” line. No calculator, no spreadsheet. Just a quick mental comparison.
Ask yourself one human question: With the way I drive, what does my usual week really cost me?
Short commute, daily school runs, or long motorway trips – the 100 km figure lets you scale your own reality almost instantly. If your round-trip commute is 40 km a day, you can see at a glance whether that’s costing you €4, €6 or €8.
From there, practical strategies appear without turning your life upside down.
Maybe you don’t change your car. But you might realise that a fuel your engine already accepts quietly saves you €3 per 100 km. Over 15,000 km a year, that’s €450. That’s not theory. That’s a weekend away, a utility bill, or a cushion against inflation.
Many drivers know this awkward moment at the station. There’s a cheaper alternative fuel, but you’re not sure if it’s really cheaper in real life. Or you’ve heard that electric driving costs less per kilometre, yet you don’t know by how much, so you postpone the decision for “someday”.
This new display chips away at that uncertainty.
An energy economist I spoke with put it bluntly: “People don’t need complex calculations. They need an anchor. ‘Per 100 km’ matches how drivers think about their lives. It turns confusion into intuition.”
A few habits that make the label work for you
Look at the 100 km cost first. Let your brain anchor on what actually matters for your budget, then check the unit price.
Compare fuels your car already allows. Petrol cars can often use different blends. Flex-fuel drivers suddenly get a very clear picture.
Think in yearly kilometres. Take the difference per 100 km and multiply by your annual mileage. One number. That’s your potential saving.
Watch electric and hybrid costs. Even if you don’t drive one yet, you’ll slowly build a realistic sense of when switching might make financial sense, especially with electricity price information already regulated and published by authorities like https://www.cre.fr.
Use it beyond the pump. Knowing your real running cost helps when negotiating commuting compensation, choosing between two job locations, or comparing cars.
A small label today, different choices tomorrow
This mandatory display won’t magically fix fuel prices or traffic jams. The station will still smell of petrol. The queue will still form on Sunday evenings. You’ll still sigh when the total flashes on the screen.
But something will have shifted in the background: the way you read the act of filling up.
For some drivers, it’ll remain a faint detail. For others, it might finally make sense of all those vague conversations about diesel, biofuel, or electric being “cheaper”. One quiet day, you may find yourself running the numbers on a hybrid, a shared car, or simply a different pump, and realising your intuition wasn’t wrong. It was just missing the right scale.
That new line on the pump isn’t there to lecture you. It’s there to whisper a question: If you truly saw what each 100 km costs you, what would you change – or not change – about the way you move?
Key takeaways at a glance
| Key point | What it means | Why it matters |
|---|---|---|
| New mandatory display | Cost per 100 km shown at the pump from 12 January | Clear, readable info instead of abstract unit prices |
| Easier energy comparison | Same scale for petrol, diesel, biofuels and electricity | Helps you see what’s really cheaper |
| Budget impact | Small differences per 100 km add up over a year | Concrete savings without changing cars overnight |
FAQs:
What exactly will gas stations have to display from 12 January?
They must add an estimated average cost per 100 kilometres for each energy type sold, alongside the usual price per litre or per kWh.
Who decides the figures shown on the pump?
The figures are calculated using standardised consumption data and methods defined by public authorities, so stations don’t invent their own numbers.
Will this change the price I pay at the pump?
No. This rule is about transparency, not pricing. You’ll pay the same, but you’ll better understand what that price means over distance.